The Most Important Part Of Eda
Detecting and Measuring Statistical Bias during EDA - Part 1
Just like an interviewer asks the typical “Tell me about yourself” as the first question during an interview, data scientists perform Exploratory Data Analysis (EDA) to get to “know” the data at hand. Benefits of a thorough EDA cannot be overlooked. Findings during EDA inform further decisions about the type of model(s) to look at and it also helps in setting expectations about the outcome early on.
Some of the common tasks that are done during EDA are -
- Looking at the size of the data and making a note of discrete, continuous and categorical columns
- Assessing number of missing values for each column (if any) and identifying the reasons behind for the missing data
- Imputing / dropping missing values using a suitable methodology
- Making bar plots (categorical data), histograms (numerical data) and other charts to look and/or present the data summary visually
- Outlier detection and treatment
While all this is important, one area which is critical to look at from Machine Learning perspective is the assessment of the presence of Statistical Bias in the dataset.
What is Statistical Bias?
A data set is considered to be biased if it cannot completely and accurately represent the underlying problem space.
If we look at ML problems at a high level, we are always trying to find underlying patterns in the data and using them to make predictions or uncover relationships among variables. Therefore, it is easy to comprehend that if the data itself is not representative of the actual scenario, we will not get accurate results doesn’t matter how hard we work on fine tuning the model. Therefore, it is critical to identify if our data suffers from the bias problem early on.
Examples of Statistical Bias -
- Spam email detection - Majority of the emails sent are non spam
- Fraud detection - The training data that is typically used is a previous set of credit card transactions that a business has access to. Now majority of the time, credit card transactions are not fraudulent. But if you’re using that biased dataset to train a model to detect fraud, then your model is very unlikely to detect fraudulent transaction because it has not seen that many fraudulent transactions before
Identifying Statistical Bias through EDA in a customer review dataset
Now let’s look at an example dataset suffering from statistical bias…
Problem statement - Given reviews of different categories of products, classify reviews as positive, neutral or negative. We look at the following data cuts in order to detect statistical bias -
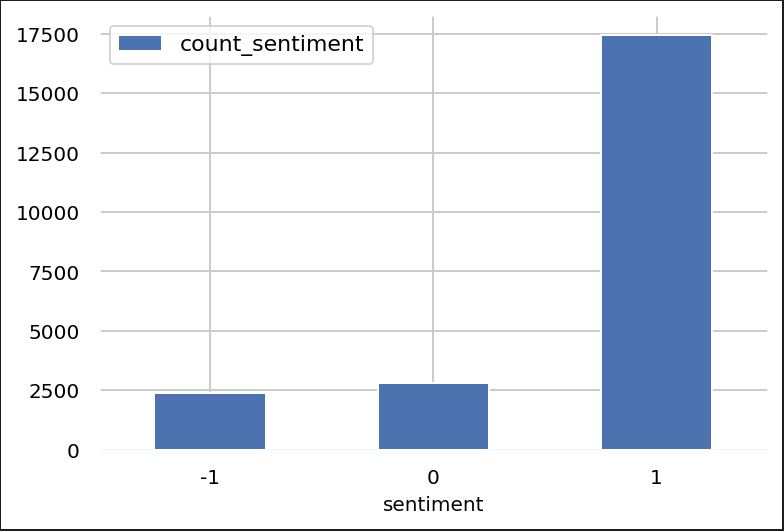
1.Distribution of # of records for positive, neutral and negative reviews
Observe that we face similar challenge as highlighted in the two examples above - majority of data points belong to a particular class (here positive sentiment) and very few negative reviews.
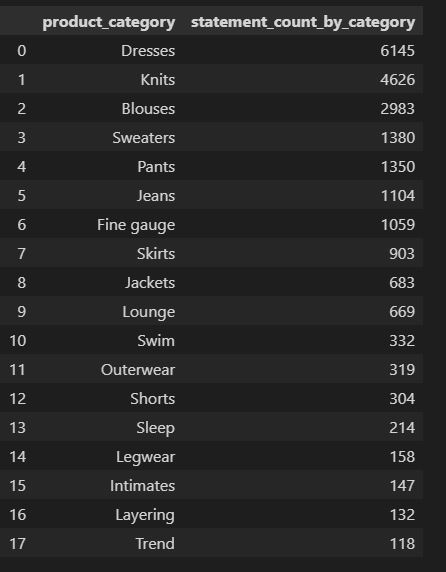
2.Count of records by product category
There is a difference in number of reviews present for different product categories as well (which is expected as there will be much more reviews for a common item such as blouses or jeans than a swimwear)
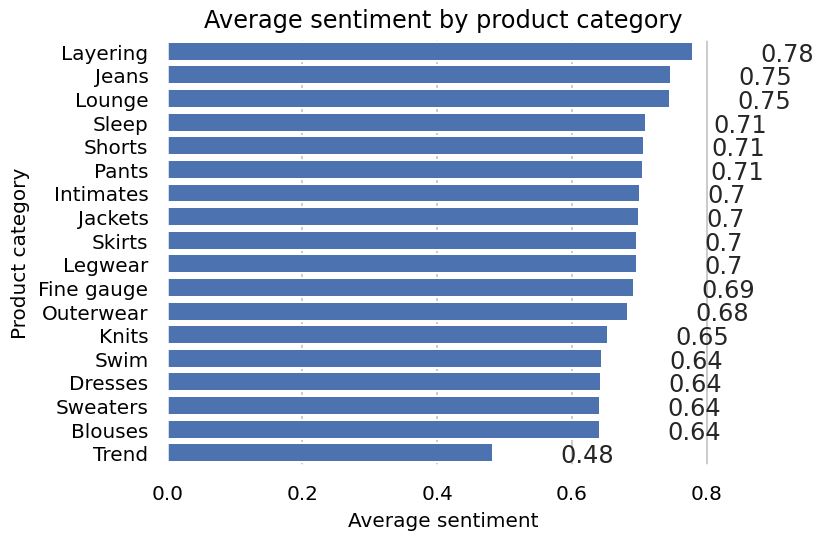
3.Avg. sentiment per category
The above chart is a more granular version of the first chart and shows that we have way more positive reviews for Jeans than Blouses
The intent behind of looking at all these charts is that we can expect the non-uniform distribution of review sentiments to affect the performance of our ML model for negative reviews as well as for categories that have very few data points.
In the next post, I will explain the ways to deal with statistical bias.


